Your Network at a Glance
A single screen that gives your NOC team complete situational awareness — real-time health bars, an attention panel surfacing what needs action, live traffic charts, and a full route matrix.
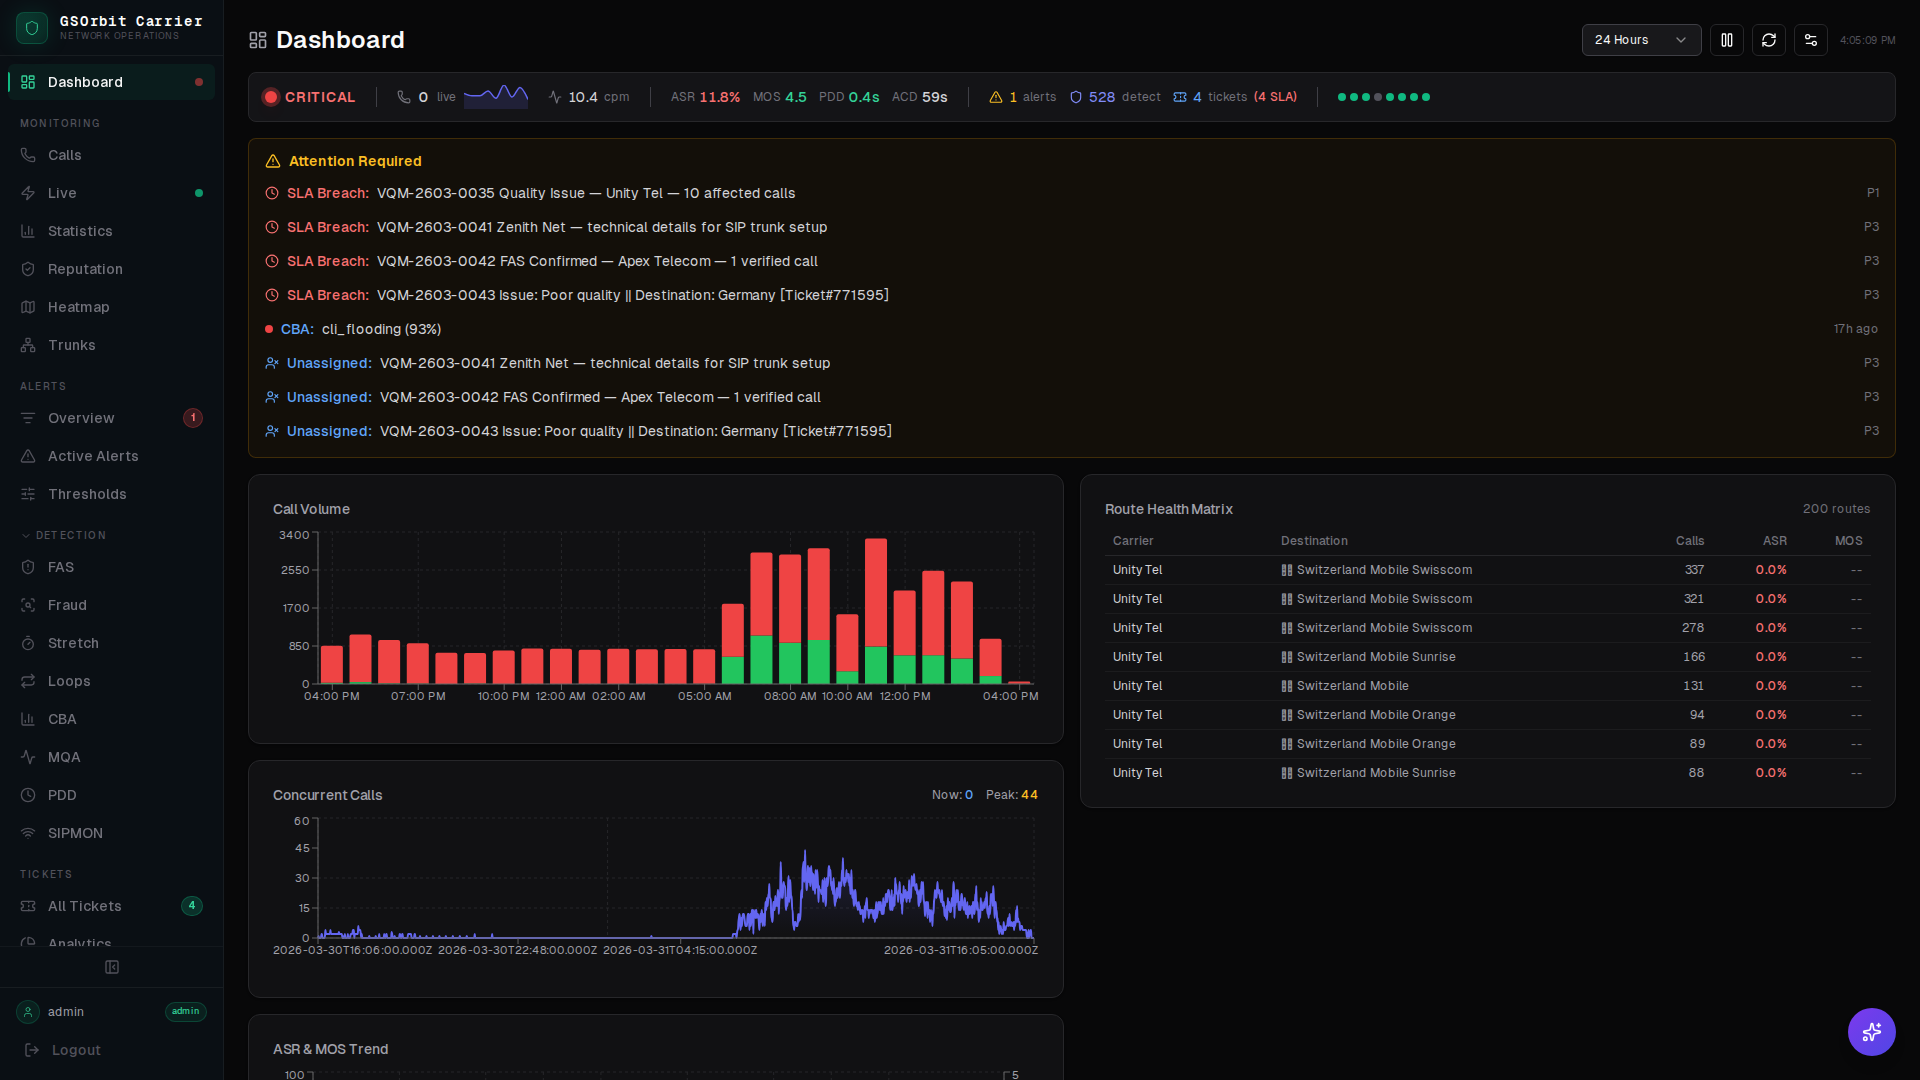
Health Bar
A live health bar aggregates signal from all 9 detection engines and your carrier feeds into a single color-coded status. Green means clean. Amber means investigate. Red means act now.
Attention Panel
The attention panel surfaces the highest-priority events from every engine — quality threshold breaches, fraud flags, loop detections, and SIP anomalies — ranked by severity and time.
Traffic Charts
Live traffic charts render call volume, ASR, ACD, and MOS trends in real time with automatic axis scaling. Zoom into the last five minutes or pull back to 24 hours.
Route Matrix
The route matrix gives a tabular view of every active route, its current health score, traffic volume, and detection engine status. Click any route to drill into its CDRs, quality history, and active alerts.
How the Dashboard Works
The dashboard aggregates live data from every GSNOC subsystem into a single coherent view, updated continuously.
- 1Detection engines and carrier feeds push events to the GSNOC event bus as they fire.
- 2The aggregation layer rolls up engine outputs into per-carrier and per-route health scores every 30 seconds.
- 3The attention panel ranks open events by severity and staleness, ensuring the most critical items always rise to the top.
- 4Charts and matrices pull from the same time-series store so every panel reflects exactly the same point in time.