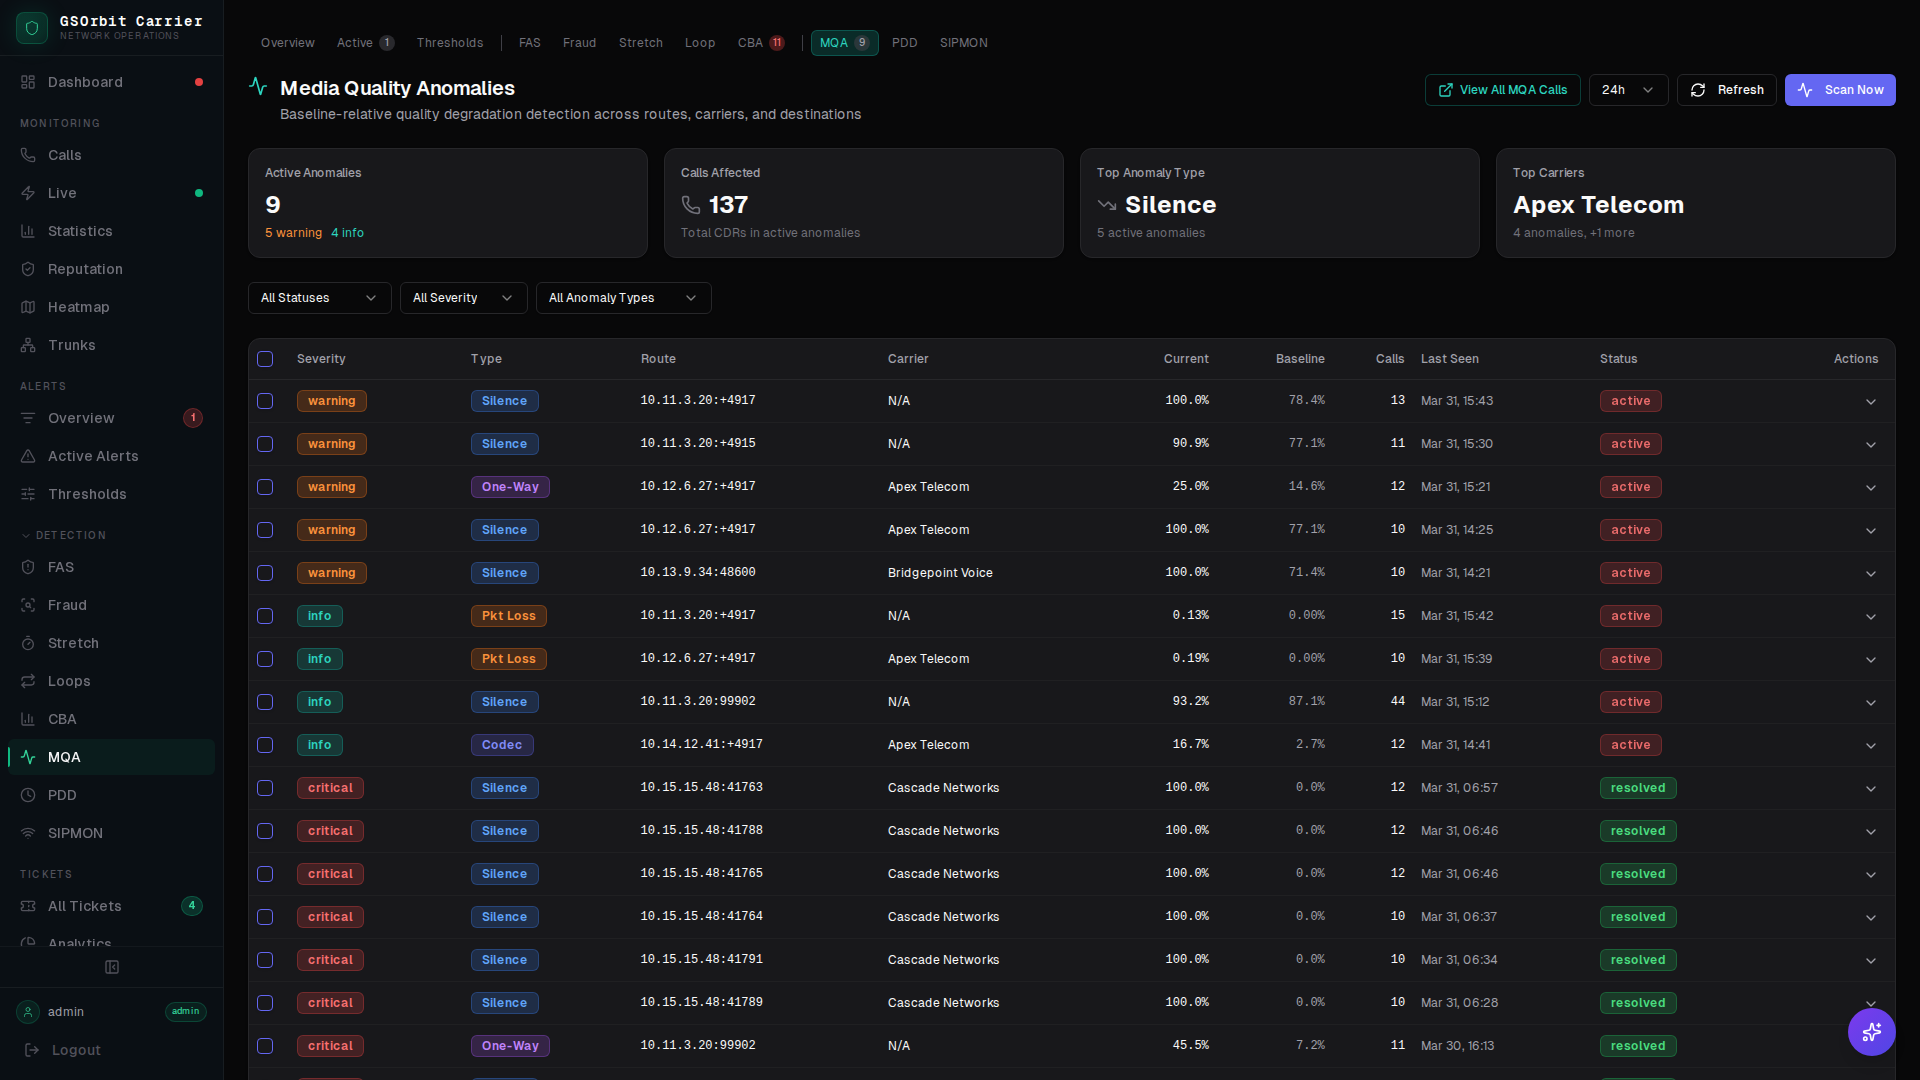
Media Quality Anomaly (MQA)
Fixed quality thresholds miss gradual degradation. MQA builds per-carrier, per-route rolling baselines and runs eight detectors to catch anomalies that thresholds can never see.
The Gradual Degradation Problem
Quality that degrades slowly never triggers fixed thresholds — MOS drops from 4.2 to 3.8 over a week while your alert floor sits at 3.5. By the time thresholds fire, customers have already noticed.
- Gradual MOS degradation missed entirely by threshold-based monitoring that only fires at absolute floors
- Different carriers having different quality baselines making universal thresholds either too sensitive or too permissive
- Multi-metric degradation that is subtle on each individual metric but significant in combination
- Trend-based problems that reverse temporarily, repeatedly triggering and clearing threshold alerts without resolution
How MQA Detection Works
Eight detectors run against rolling 7-day per-carrier and per-route baselines, catching statistical deviations that fixed thresholds miss.
Compares current MOS to the 7-day rolling baseline per carrier and route. Flags statistically significant drops even when absolute MOS remains above threshold floors.
Detects jitter values that deviate significantly from the per-carrier baseline, distinguishing genuine degradation from expected variation.
Flags packet loss rates that exceed the statistical norm for a route, even when the absolute rate appears low.
Detects unexpected changes in codec distribution or codec-specific quality that indicate transcoding issues or negotiation failures.
Identifies when multiple metrics degrade simultaneously — a stronger signal of genuine carrier issues than any single metric anomaly.
Weights recent quality data more heavily than older data so baseline shifts reflect current carrier performance accurately.
Maintains separate baselines per carrier, route, and direction so each route's anomaly detection is calibrated to its own normal behavior.
Identifies sustained downward quality trends even when no single measurement crosses an anomaly threshold.
Why GSNOC MQA Is Different
- 7-day rolling baselines mean anomaly detection adapts to each carrier's actual performance rather than global thresholds
- Eight detectors working together catch the multi-metric degradation patterns that single-metric systems miss
- Per-carrier and per-route baselines eliminate the false positive problem of applying one standard to all routes
Key Metrics
7-day rolling average MOS for the carrier and route — the reference point for anomaly detection
MOS measured in the current evaluation window
Statistical distance of current quality from baseline — higher z-scores indicate stronger anomalies
Whether quality is improving, stable, or deteriorating relative to the rolling baseline
Number of carrier routes currently showing anomalous quality versus baseline