Data-DrivenNetwork Intelligence
Deep traffic analytics built for carrier-grade VoIP. Track quality trends, understand SIP response patterns, and break down performance by carrier, codec, and route.
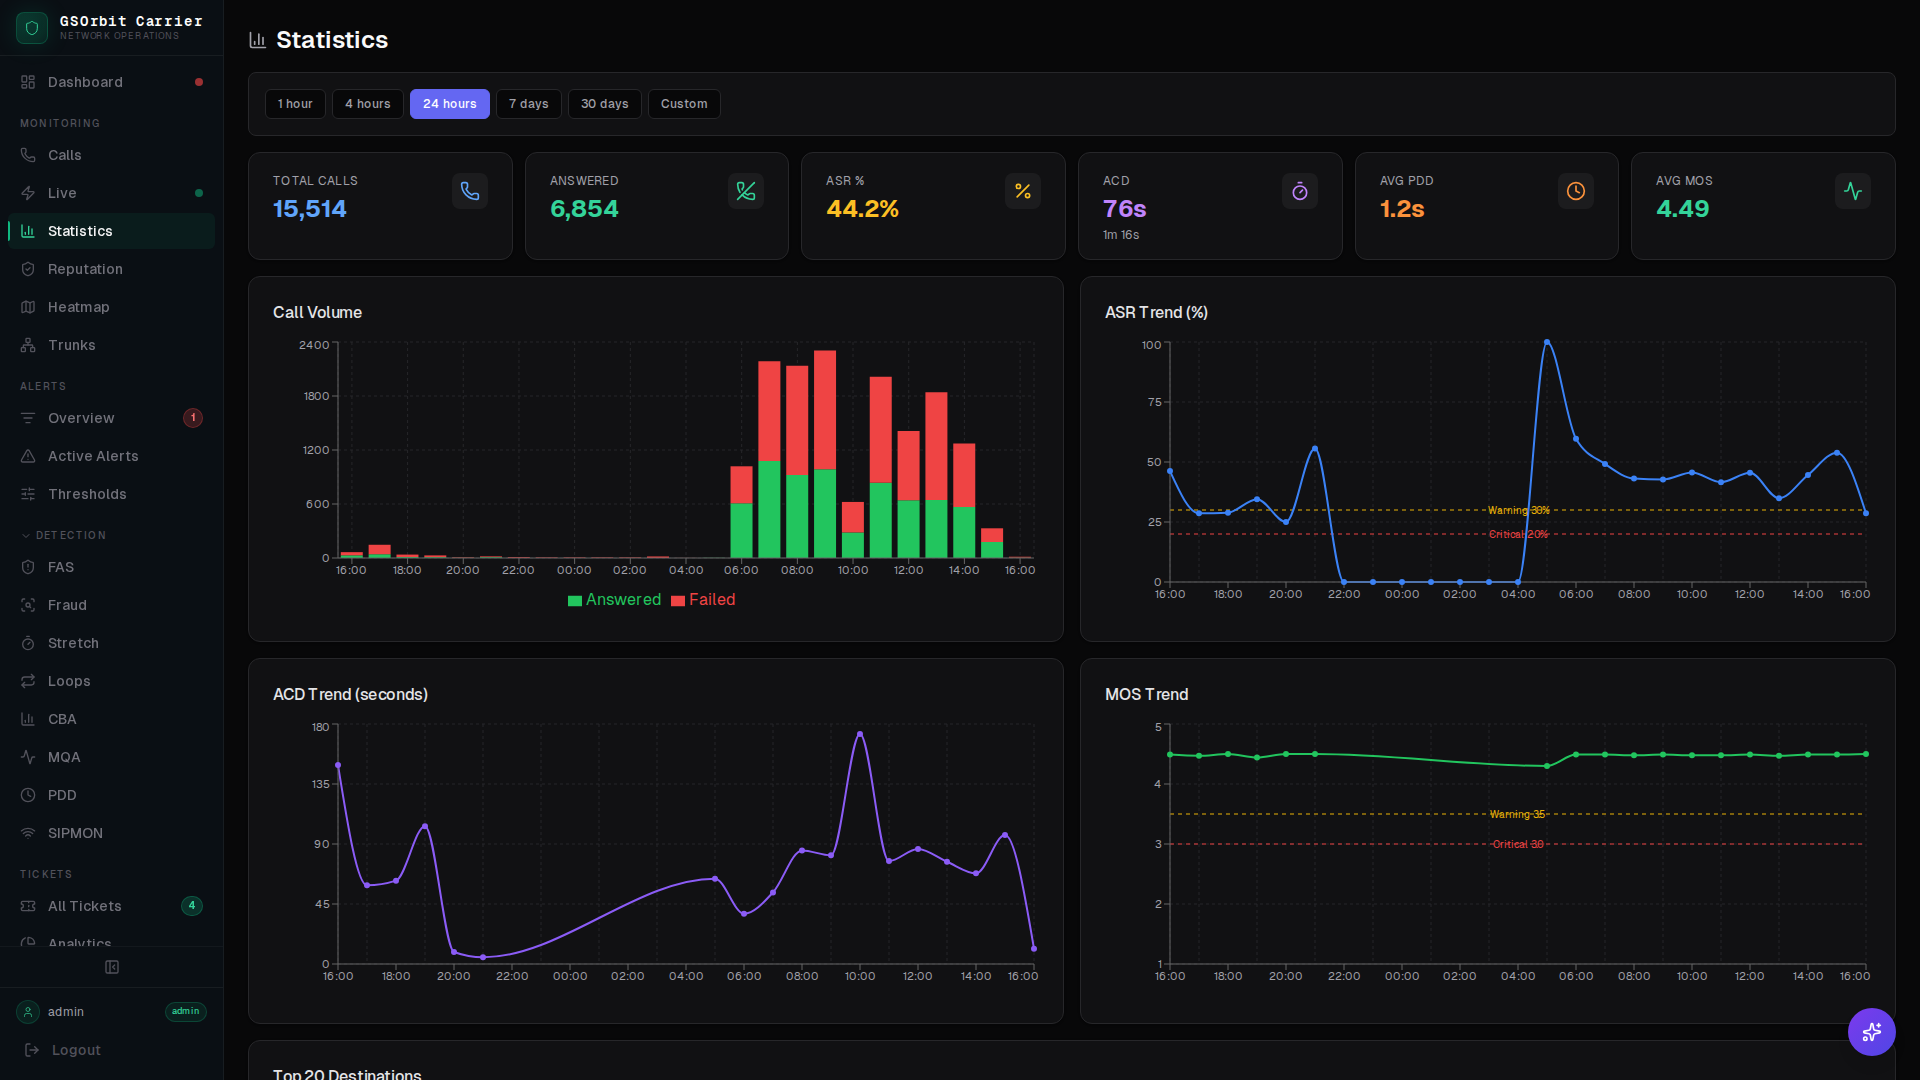
Quality Trends
Track ASR, ACD, and MOS over time with configurable windows from 1 hour to 90 days. Overlay multiple carriers on the same chart to instantly spot which route is degrading relative to its peers.
SIP Response Codes
Break down call outcomes by SIP response code — 200 OK, 486 Busy, 503 Service Unavailable, 408 Timeout, and more. Identify carriers with abnormal 5xx rates before they cause customer-impacting failures.
Codec Distribution
See exactly which codecs are flowing across your network and how quality varies by codec. Identify codec negotiation mismatches, carriers forcing G.711 where G.729 was expected, and unexpected transcoding chains.
Per-Carrier Breakdowns
Filter any metric by carrier, route, direction, or time window. Compare carrier performance head-to-head with side-by-side charts. Export filtered datasets for SLA review meetings or audit documentation.